News
All News
Today
Trending
Tools
Real Time Chart
Forex Heatmap
Stock Heatmap
Crypto Heatmap
Market Data
Economic Calendar
Position Calculator
Categories
Publications
Contact
Login
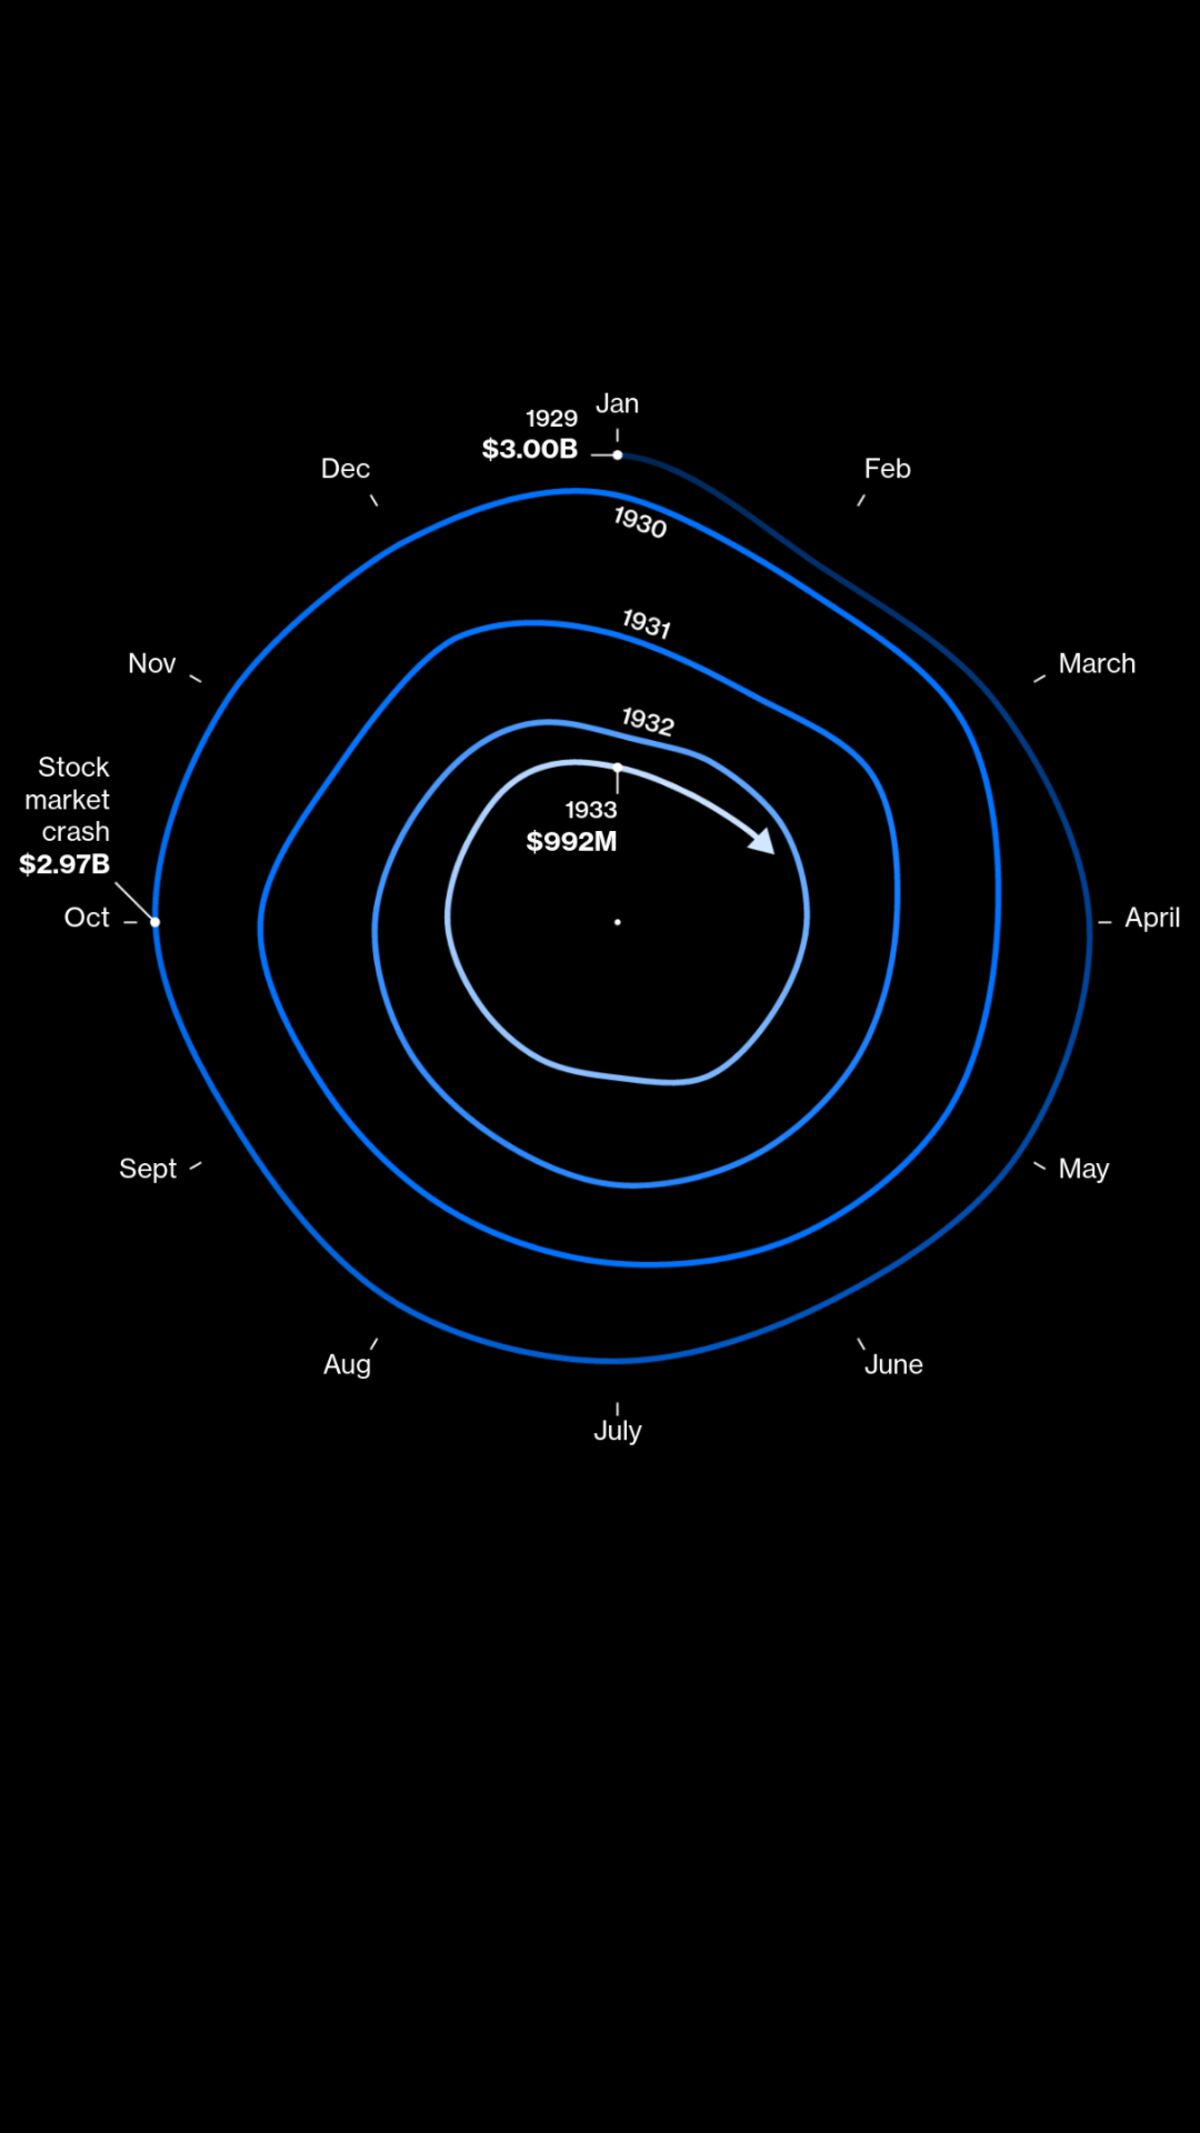
Can This Chart Predict Economic Depressions?
Markets
·
April 7, 2025
·
Bloomberg
Some experts think that Kindleberger’s Spiral shows that tariffs caused the Great Depression in the 1930s. But the chart is not really about trade wars, explains Bloomberg Opinion columnist Paul Davies (Source: Bloomberg)
More from
Bloomberg
Markets
Traders ‘Hold Their Nerve’ to Ride Bumpy Emerging Market Rally
June 15, 2025
·
Bloomberg
Markets
Trump’s Executive Order to Make Flying Cars a Reality
June 15, 2025
·
Bloomberg
Markets
Egypt’s Pound, Stocks Take Blows From Worsening Mideast Conflict
June 15, 2025
·
Bloomberg
More
Markets
Articles
Markets
Traders ‘Hold Their Nerve’ to Ride Bumpy Emerging Market Rally
June 15, 2025
·
Bloomberg
Markets
Trump’s Executive Order to Make Flying Cars a Reality
June 15, 2025
·
Bloomberg
Markets
Egypt’s Pound, Stocks Take Blows From Worsening Mideast Conflict
June 15, 2025
·
Bloomberg
Trending News
Markets
CATL Shares Clouded by Bleak Outlook After Mega Hong Kong Debut
June 13, 2025
·
Bloomberg
Markets
Muted US Producer Prices Add to String of Tame Inflation Reports
June 12, 2025
·
Bloomberg
Business & Finance
Trump Organization to discuss new Vietnam tower as trade talks continue
May 19, 2025
·
Financial Times
Enjoy premium content in your inbox.
You're in! Check your email to learn more.
Oops! Something went wrong while submitting the form.